A defensible stocking decision for every spare part — not gut feel
Score spare parts against seven weighted criteria to produce a ranked criticality result and stocking recommendation — one part at a time, or your whole register in a single upload.
Most storerooms are stocked on memory and habit
The typical spare parts holding strategy — if it can be called a strategy — is a combination of what was there when the current planner arrived, what got added after the last emergency, and what nobody has got around to removing. The result is money tied up in slow-moving parts that rarely get touched, sitting alongside critical components that aren’t held in stock at all because nobody formally identified them as such.
Criticality assessment changes that: each part is scored against the factors that actually determine whether it needs to be held — what happens if it’s unavailable, how long it takes to source, whether a substitute exists, how often it gets consumed. The result isn’t just a number. It’s a stocking recommendation and a documented reason for it.
And when procurement, management, or an auditor asks why a part is or isn’t held in stock, a scored, ranked assessment is the difference between a defensible answer and a shrug.
Without a structured process, every stocking decision is an opinion — and opinions vary depending on who makes them. A new planner inherits a storeroom full of parts with no documented rationale for any of it. A procurement review challenges a holding and there’s no evidence to point to. A critical part runs out because it wasn’t formally identified as critical — it was just assumed someone had thought about it. Informal approaches also scale badly: you can assess ten parts by memory, but working through a full parts register without a structured tool produces inconsistent results at best and missed critical parts at worst.
Seven criteria. One defensible score.
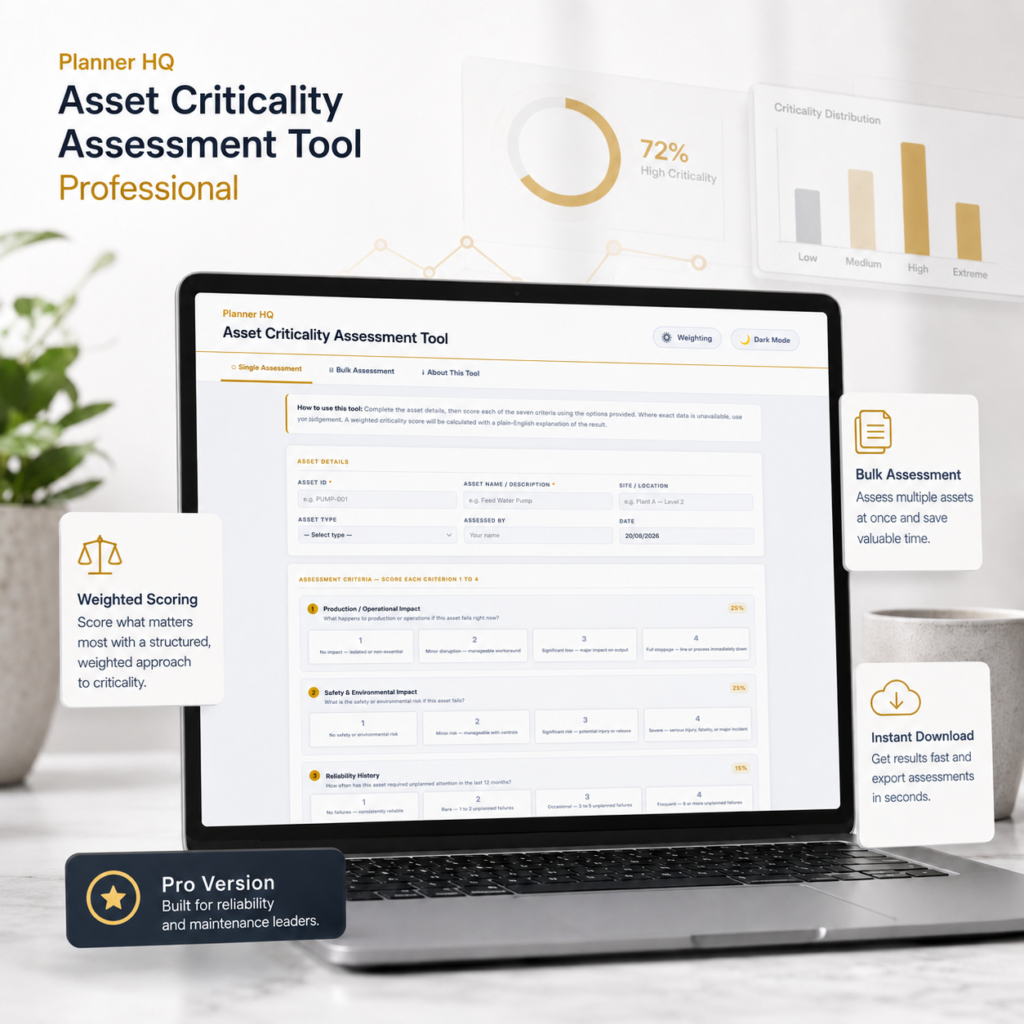
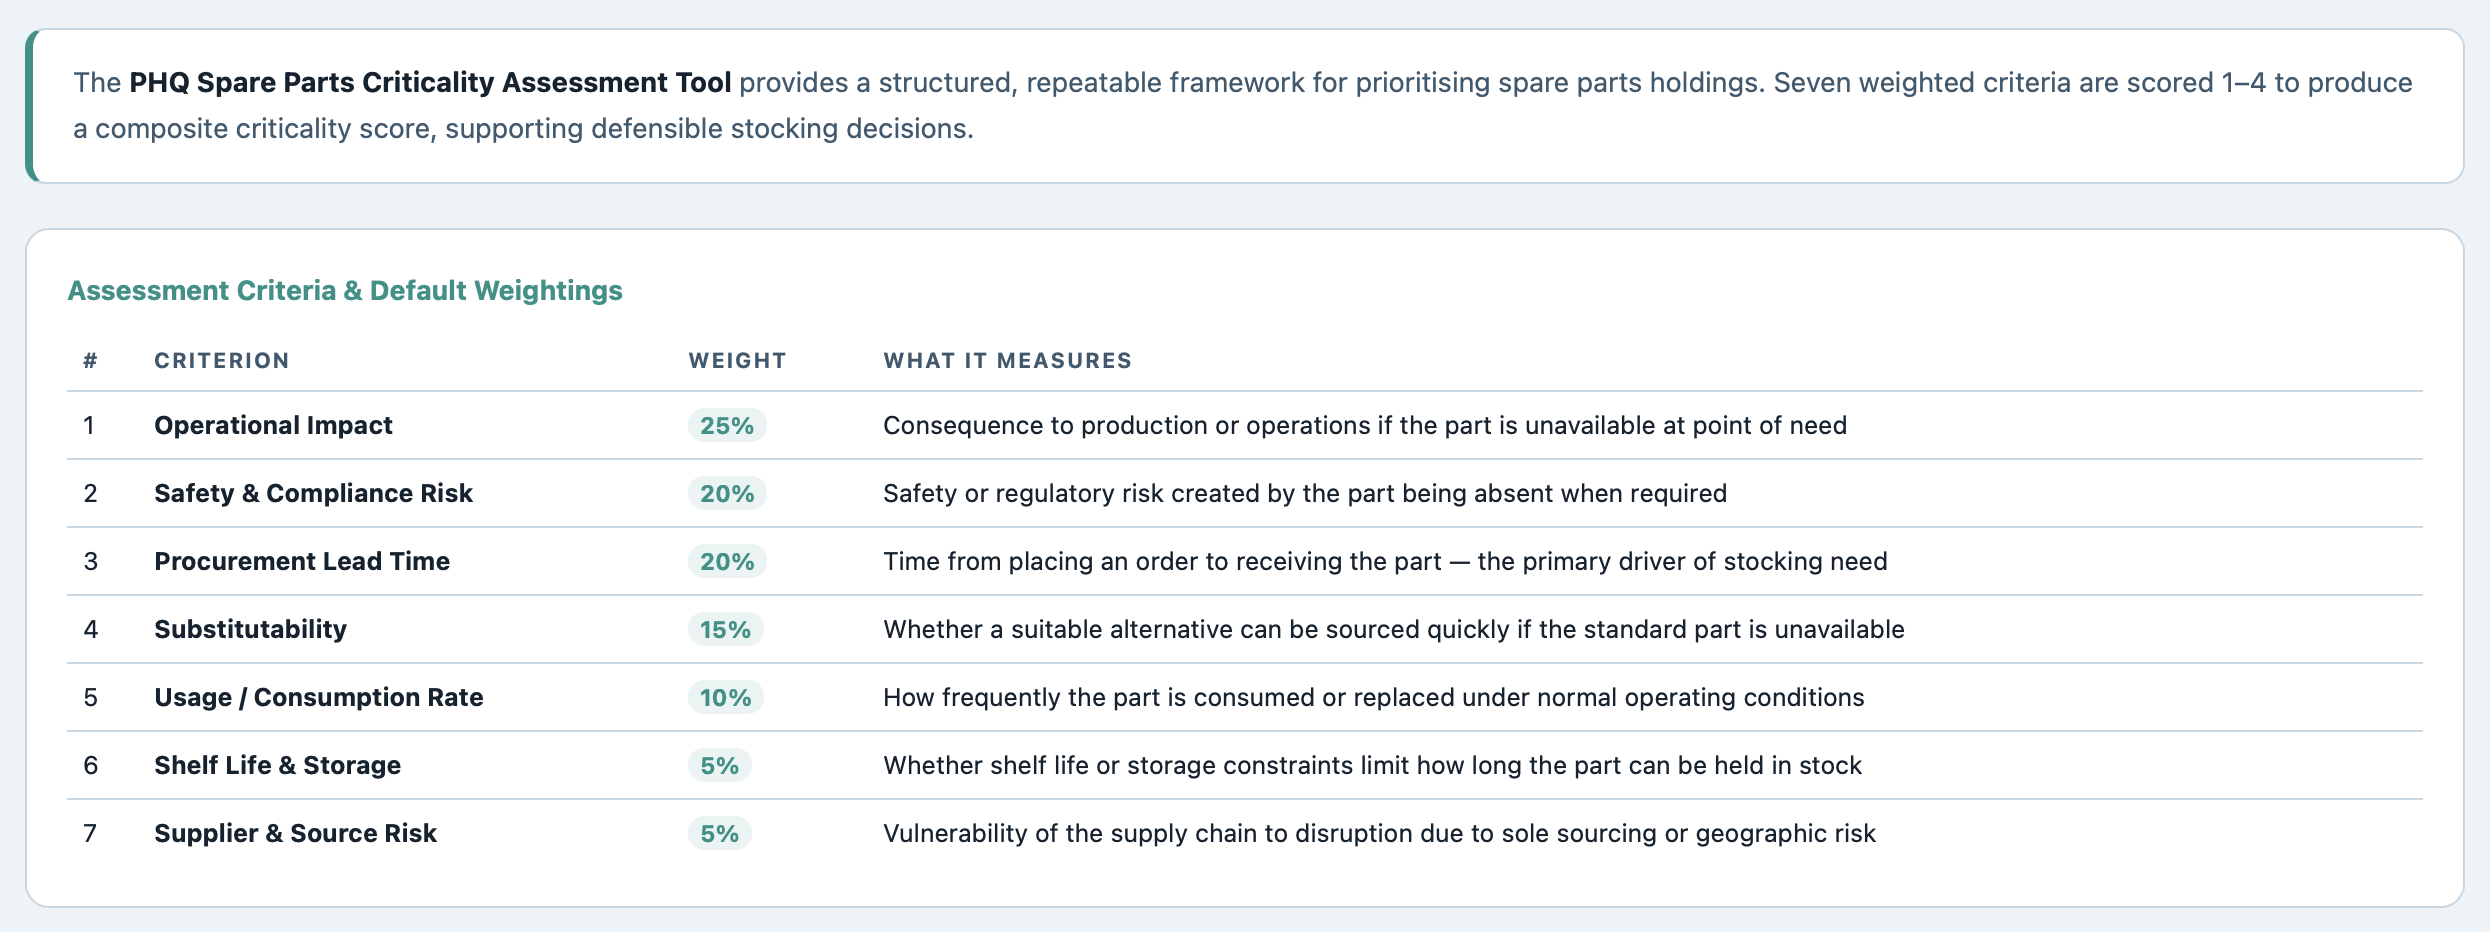
Each part is scored 1–4 against seven criteria. Scores are multiplied by their respective weightings and summed to produce a composite score out of 100, falling into a Low, Medium, or High criticality band.
| # | Criterion | Default Weight | What it measures |
| 1 | Operational Impact if Unavailable | 25% | Consequence to production or operations if the part is unavailable at point of need |
| 2 | Safety & Compliance Risk | 20% | Safety or regulatory risk created by the part being absent when required |
| 3 | Procurement Lead Time | 20% | Time from placing an order to receiving the part — the primary driver of stocking need |
| 4 | Substitutability | 15% | Whether a suitable alternative can be sourced quickly if the standard part is unavailable |
| 5 | Usage / Consumption Rate | 10% | How frequently the part is consumed or replaced under normal operating conditions |
| 6 | Shelf Life & Storage | 5% | Whether shelf life or storage constraints limit how long the part can be held in stock |
| 7 | Supplier & Source Risk | 5% | Vulnerability of the supply chain to disruption due to sole sourcing or geographic risk |
Default weightings — Pro version allows you to adjust all seven to match your site’s risk profile. On a smaller screen? Scroll sideways to see the full table.
Built for the annual review, not just the one-off question
What it does:
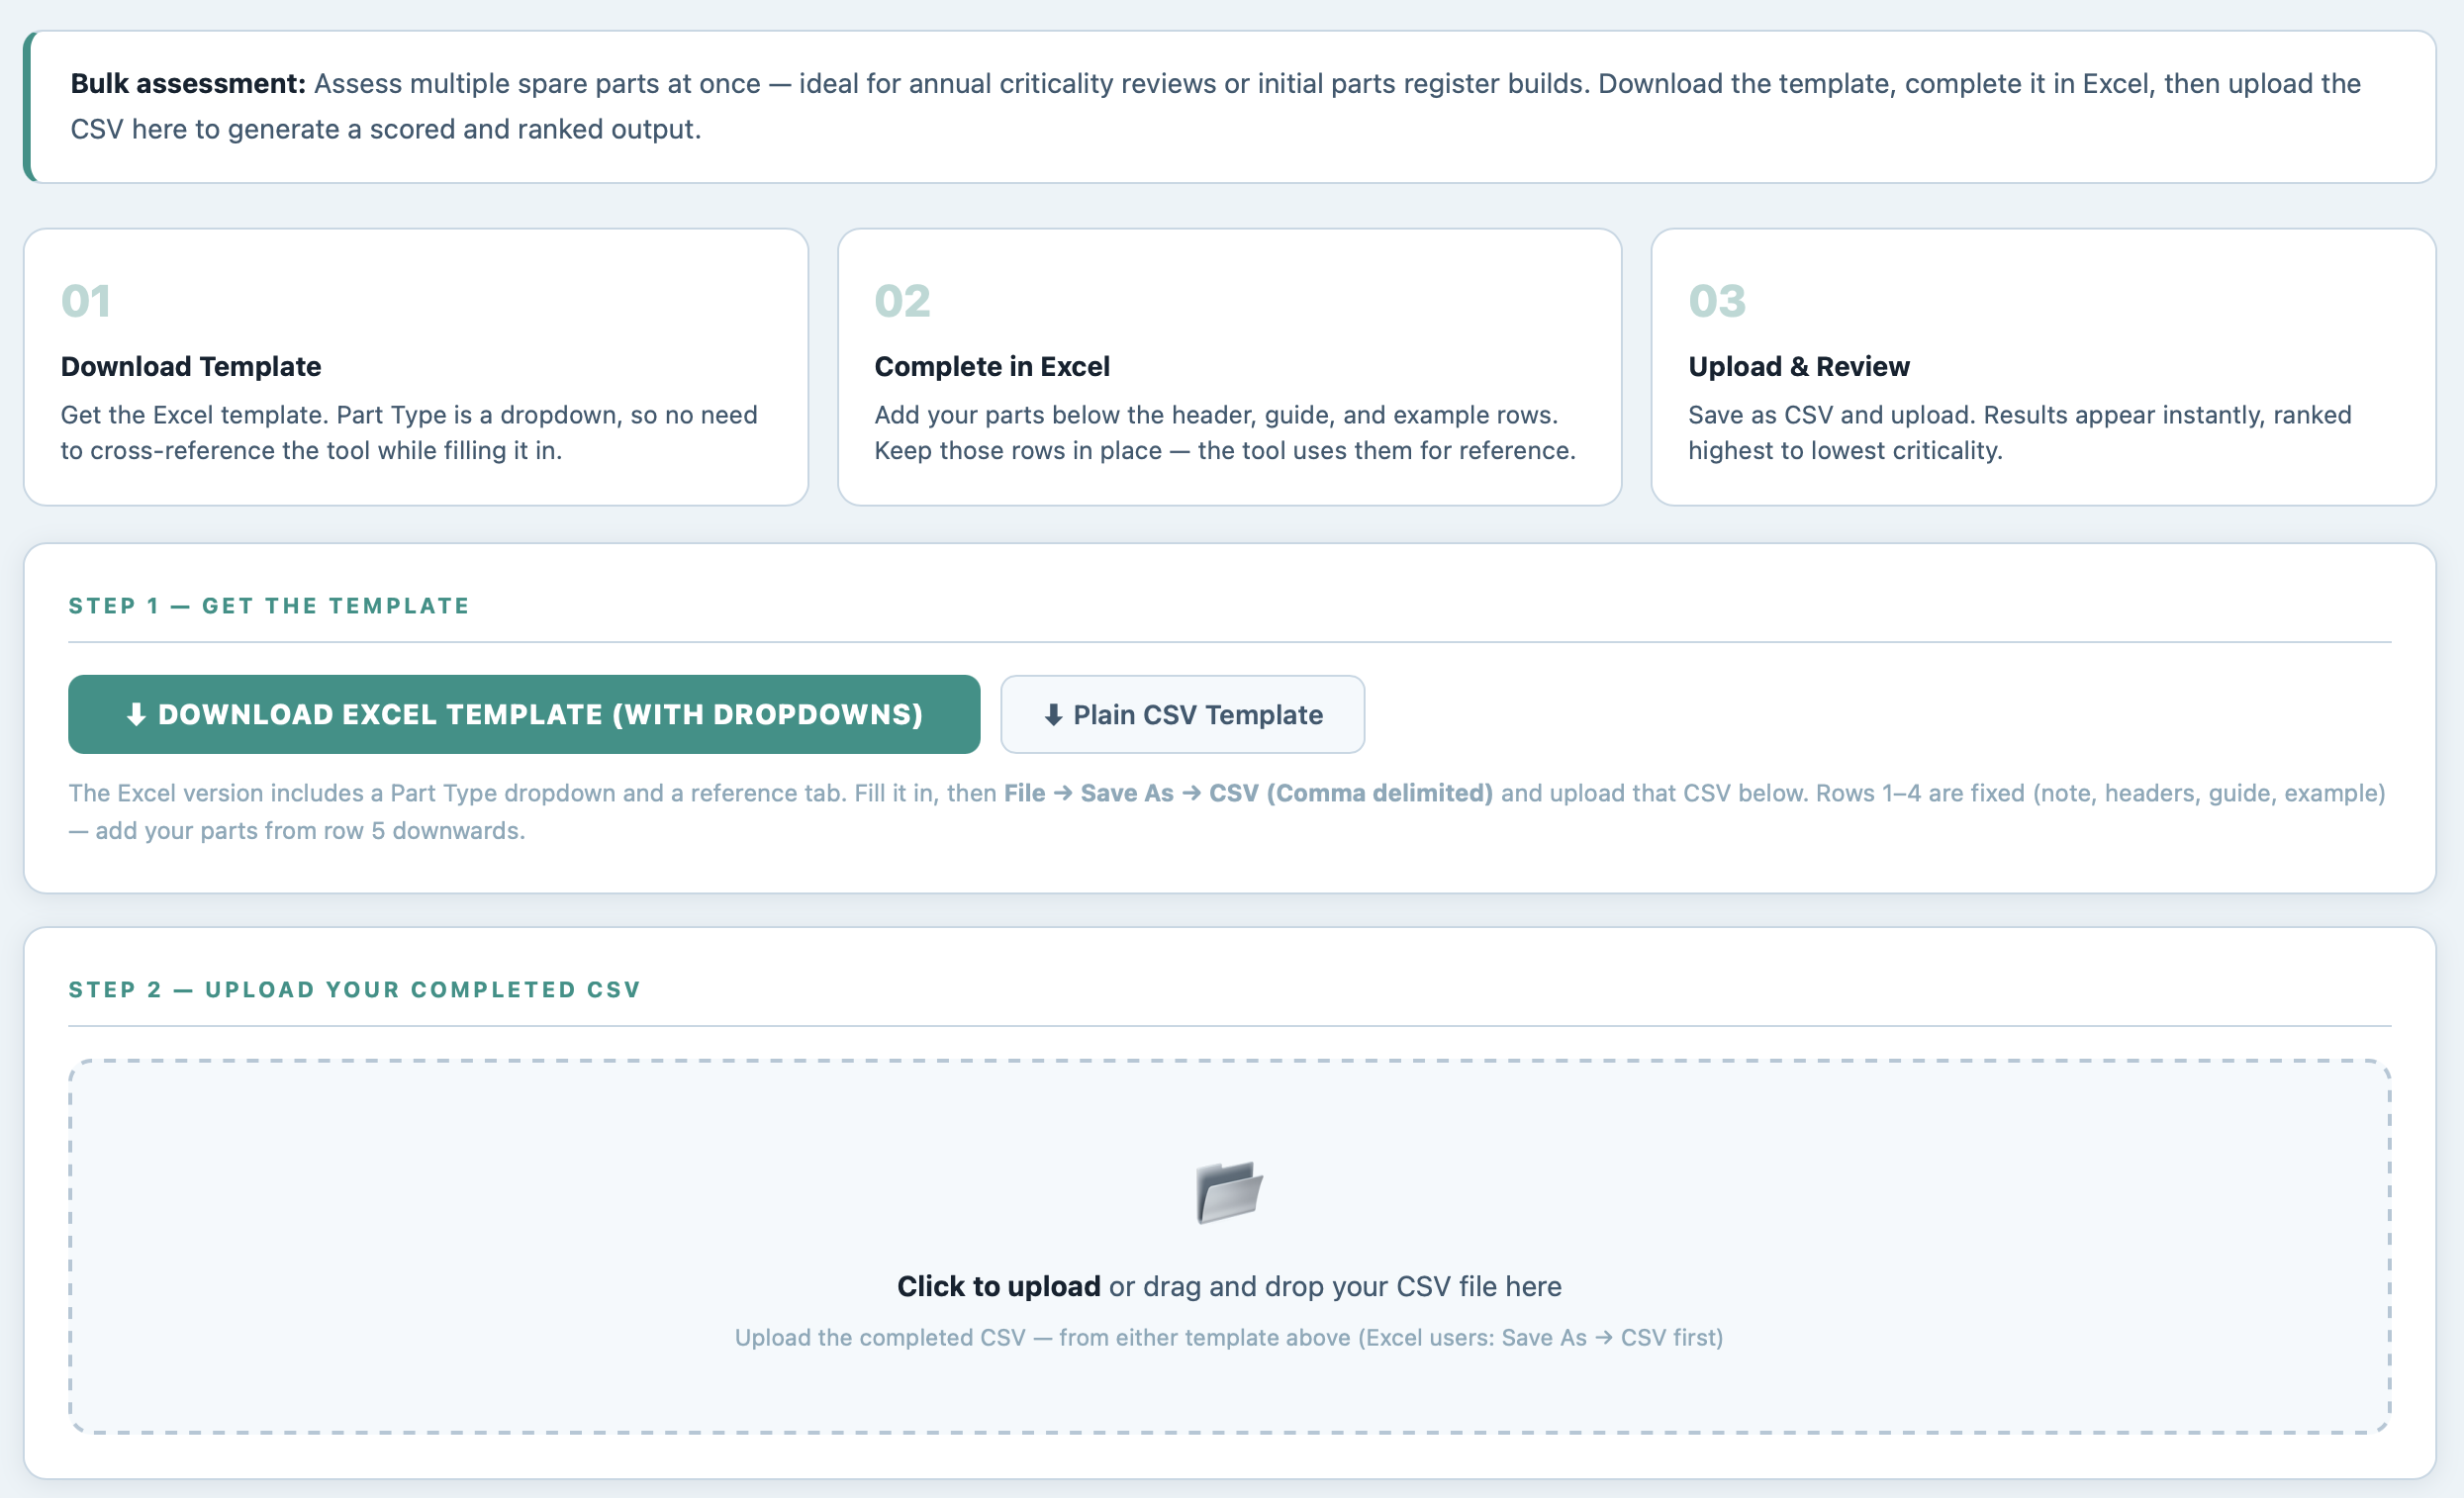
download the Excel template (Part Type is a dropdown, so there’s nothing to look up while filling it in), list your parts, save as CSV, and upload. Every part is scored and ranked in one pass — built for working through a full parts register, not just one part at a time.
How it works:
the same seven weighted criteria and scoring rules apply to every row, so a hundred parts get assessed exactly as consistently as one. No drift between whoever filled in row 4 and whoever filled in row 96.
What you get:
a fully ranked output — highest to lowest criticality — with a CSV export ready to load straight into your CMMS, EAM, or parts register. Not a PDF you have to retype.
Operational Impact — 25%
Safety & Compliance Risk — 20%
Procurement Lead Time — 20%
Substitutability — 15%
Usage / Consumption Rate — 10%
Shelf Life & Storage — 5%
Supplier & Source Risk — 5%
What it does:
the default weighting works well as a starting point, but no two sites carry risk the same way. A site heavily dependent on single-source suppliers might weight Supplier & Source Risk far higher; one with reliable, local supply chains might weight Lead Time down. Pro lets you adjust all seven weightings to reflect how your operation actually operates.
How it works:
sliders in the Weighting panel adjust each criterion from 0% to 30% in 5% steps. The tool ensures the seven weightings always sum to exactly 100%, so there’s no risk of an off-by-one error invalidating the results.
What you get:
criticality scores that reflect your site’s actual risk profile, not an industry generic — and a documented weighting model you can show to whoever questions a stocking decision.
What it does:
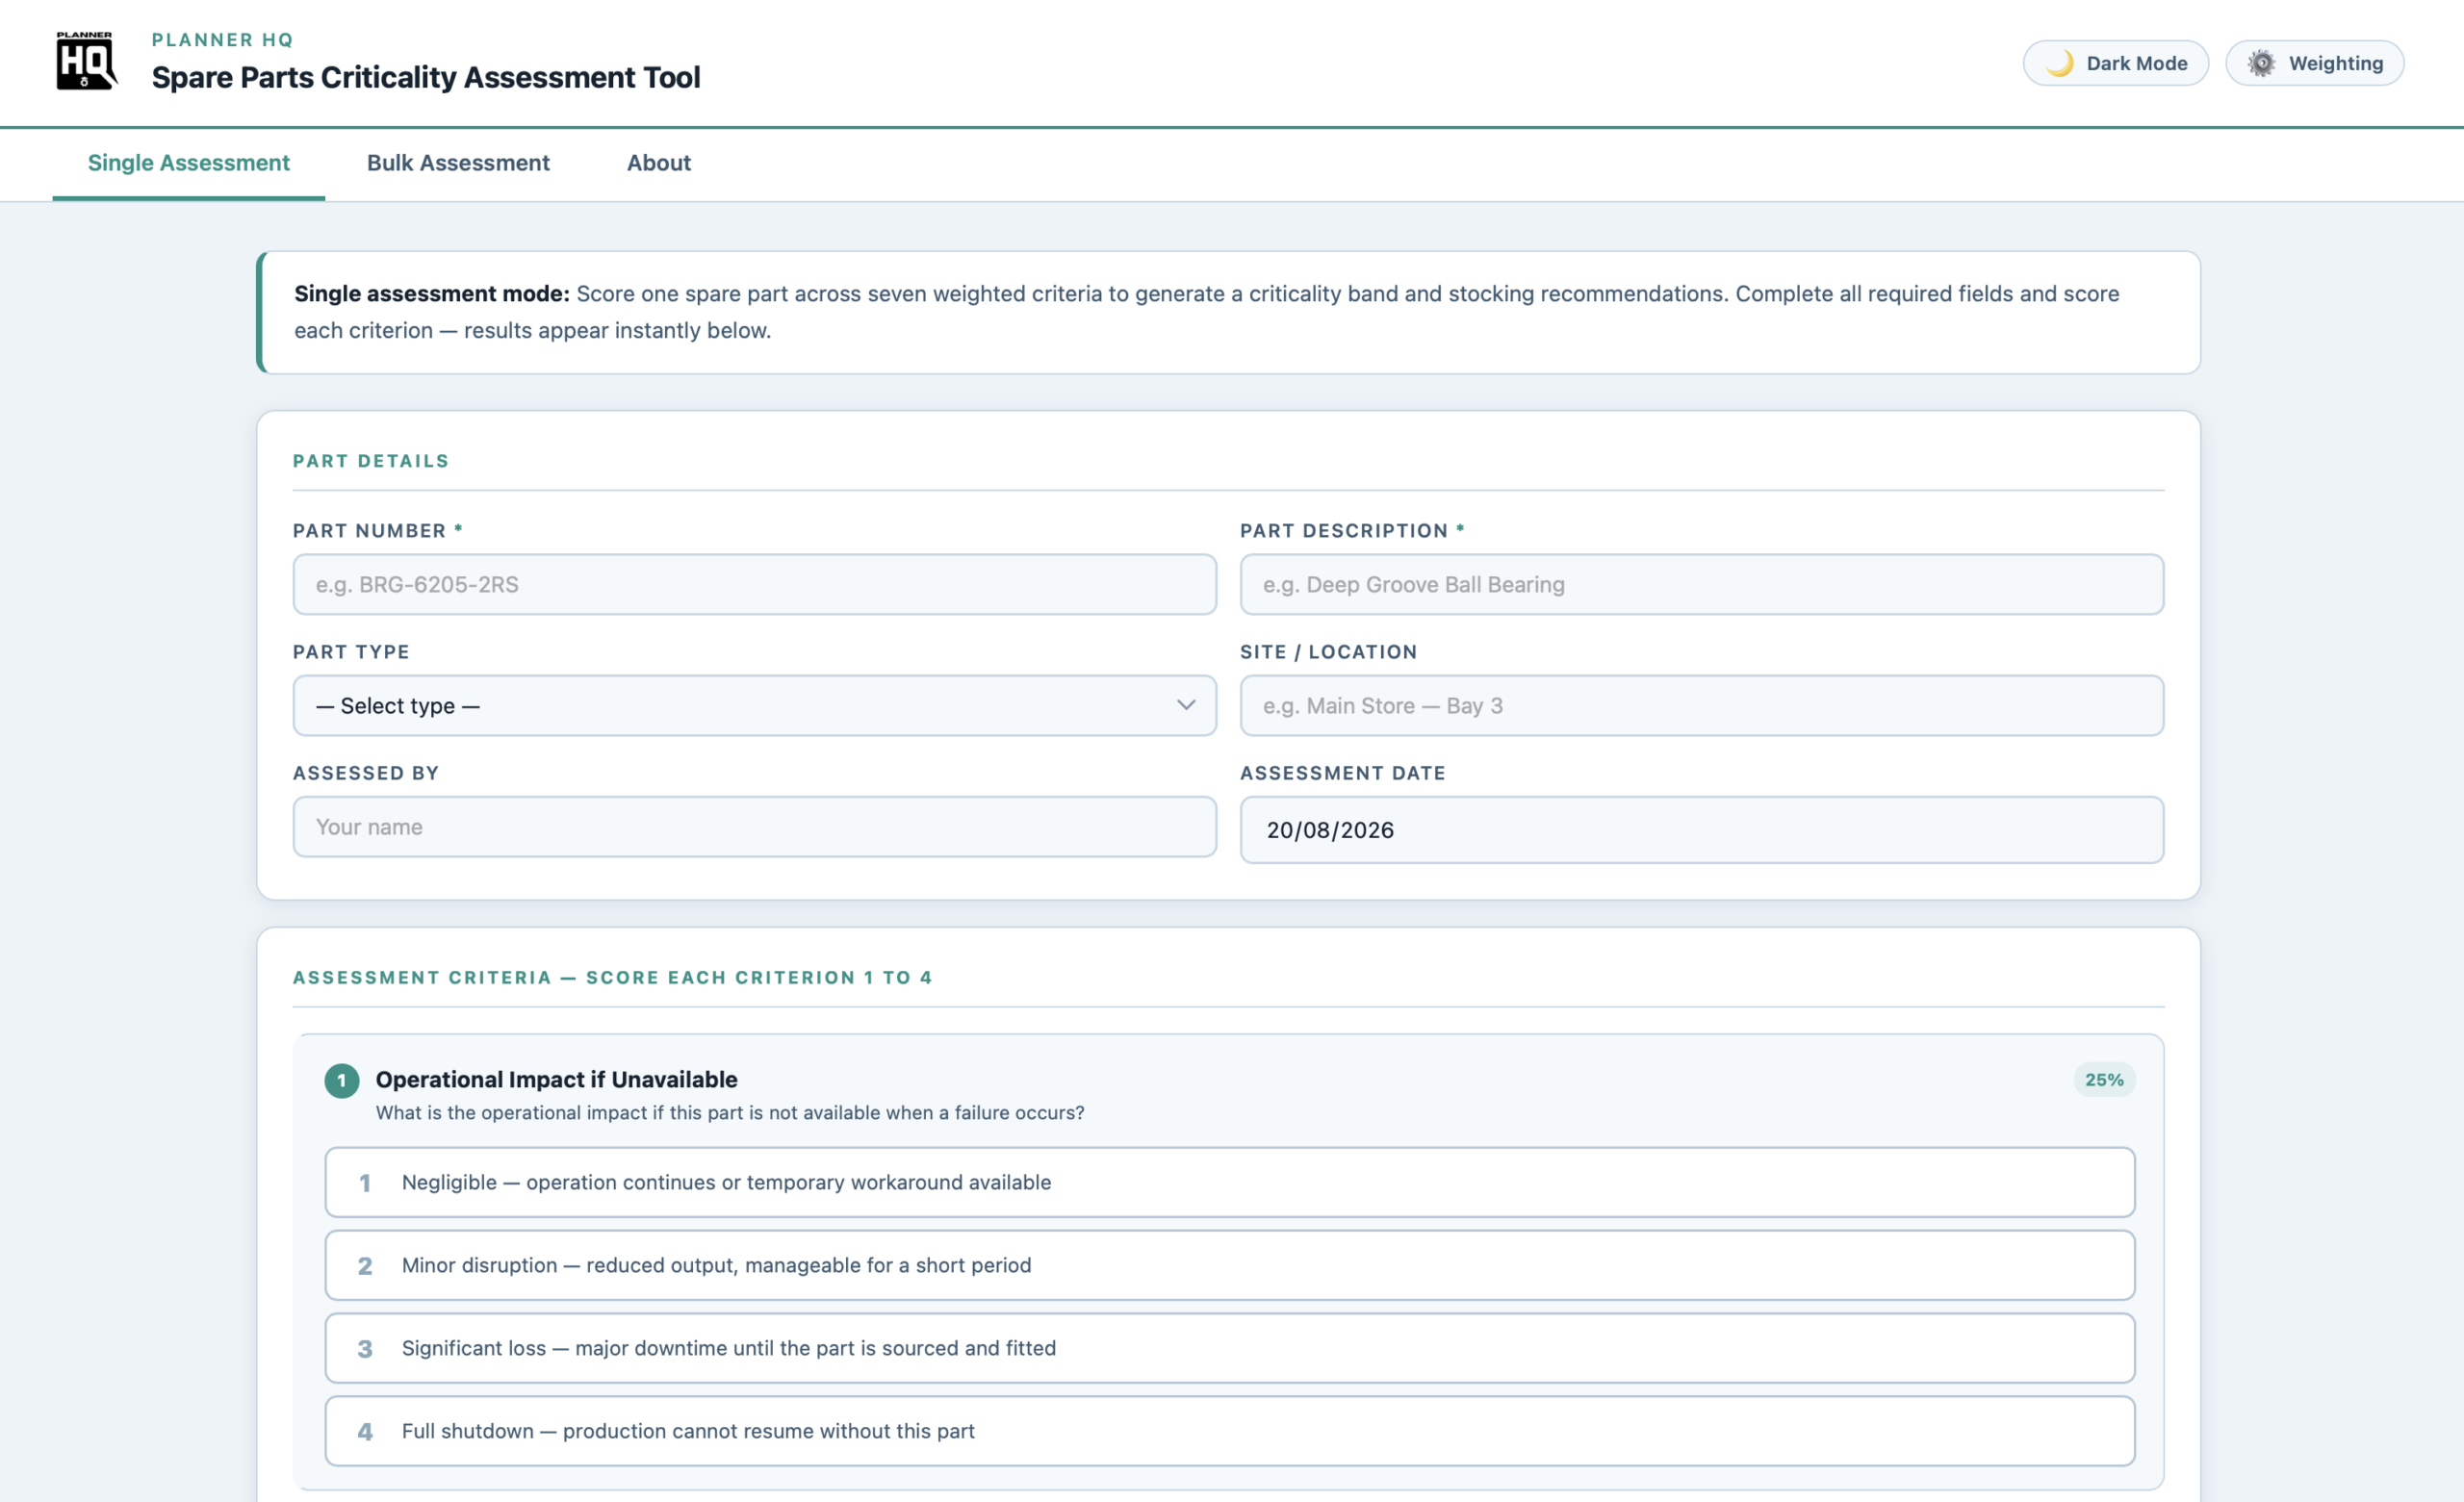
score one part against the seven criteria using the plain-language options provided — no need to look up reference data, each option describes the situation in terms you can apply directly. Results appear the moment all criteria are scored.
How it works:
each criterion is scored 1 (lowest risk) to 4 (highest risk). The tool multiplies each score by its weighting, sums the result, and places the part into a Low (0–40), Medium (41–70), or High (71–100) criticality band with an instant visual result.
What you get:
a scored result with the key drivers flagged — which criteria pulled the score up or held it down — and a stocking recommendation attached to the band. You can also export single assessments to CSV, making it straightforward to build up a parts register one part at a time if that suits your workflow.
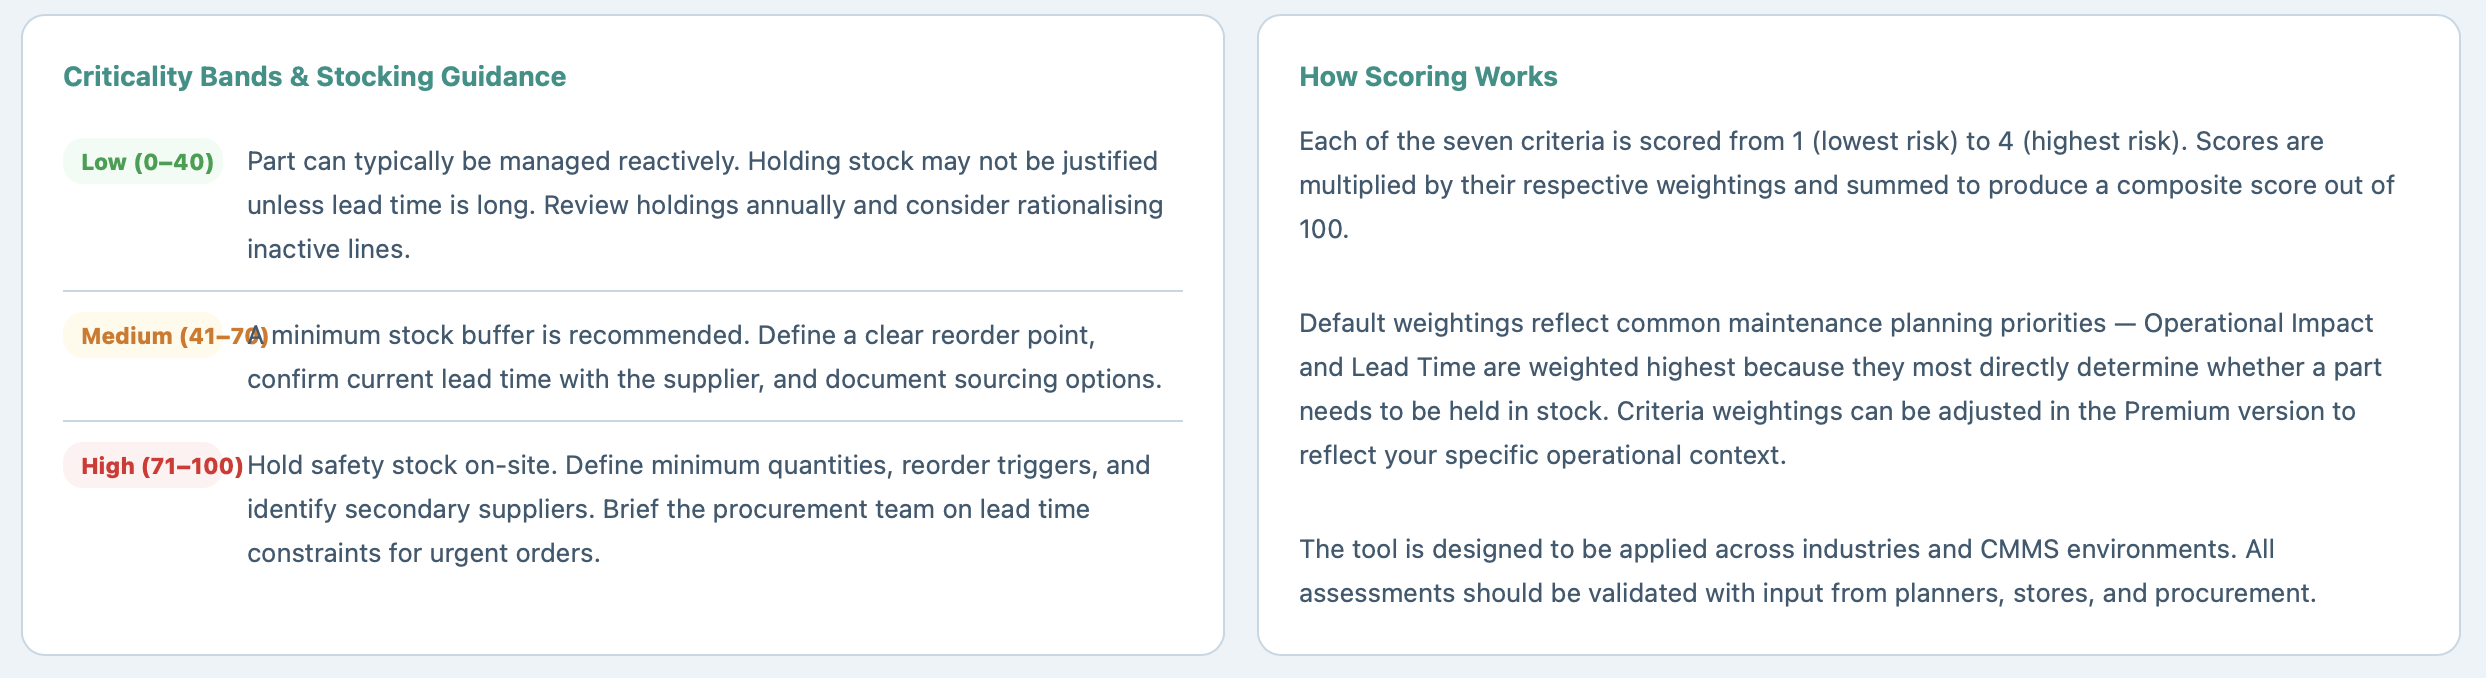
What it does:
each criticality band carries specific stocking guidance — not just a label, but a concrete recommendation: Low parts can typically be managed reactively; Medium parts need a minimum stock buffer with a defined reorder point; High parts warrant safety stock on-site with secondary suppliers identified and procurement briefed on lead time constraints.
How it works:
the guidance is displayed alongside every result — individual or bulk — so the output isn’t just a score you have to interpret, it’s a recommendation you can act on directly.
What you get:
a complete output you can hand to a stores manager, a procurement team, or include in a capital or budget submission — with the assessment methodology documented in the same tool.
| ✓ | Single Assessment — score one part, instant result with key drivers flagged |
| ✓ | Bulk Assessment — upload up to 200 parts via CSV, get a fully ranked output |
| ✓ | Excel template with built-in Part Type dropdown, plus a plain CSV option |
| ✓ | Ranked CSV export, ready for CMMS, EAM, or ERP import |
| ✓ | Customisable criterion weighting — seven sliders, always summing to 100% |
| ✓ | Stocking guidance with every result — Low, Medium, and High band recommendations |
| ✓ | Methodology reference built into the About tab — criteria, weightings, and scoring explained |
| ✓ | Light and dark mode |
| ✓ | Fully offline — works in any browser, no install, no login |
| ✓ | One-time purchase — no subscription, yours to keep |
Maintenance planners and storeroom managers working through a full parts register to build a defensible stocking strategy, rationalise inactive holdings, prepare a parts criticality register for CMMS input, or provide evidence behind a spares budget submission or procurement review.