
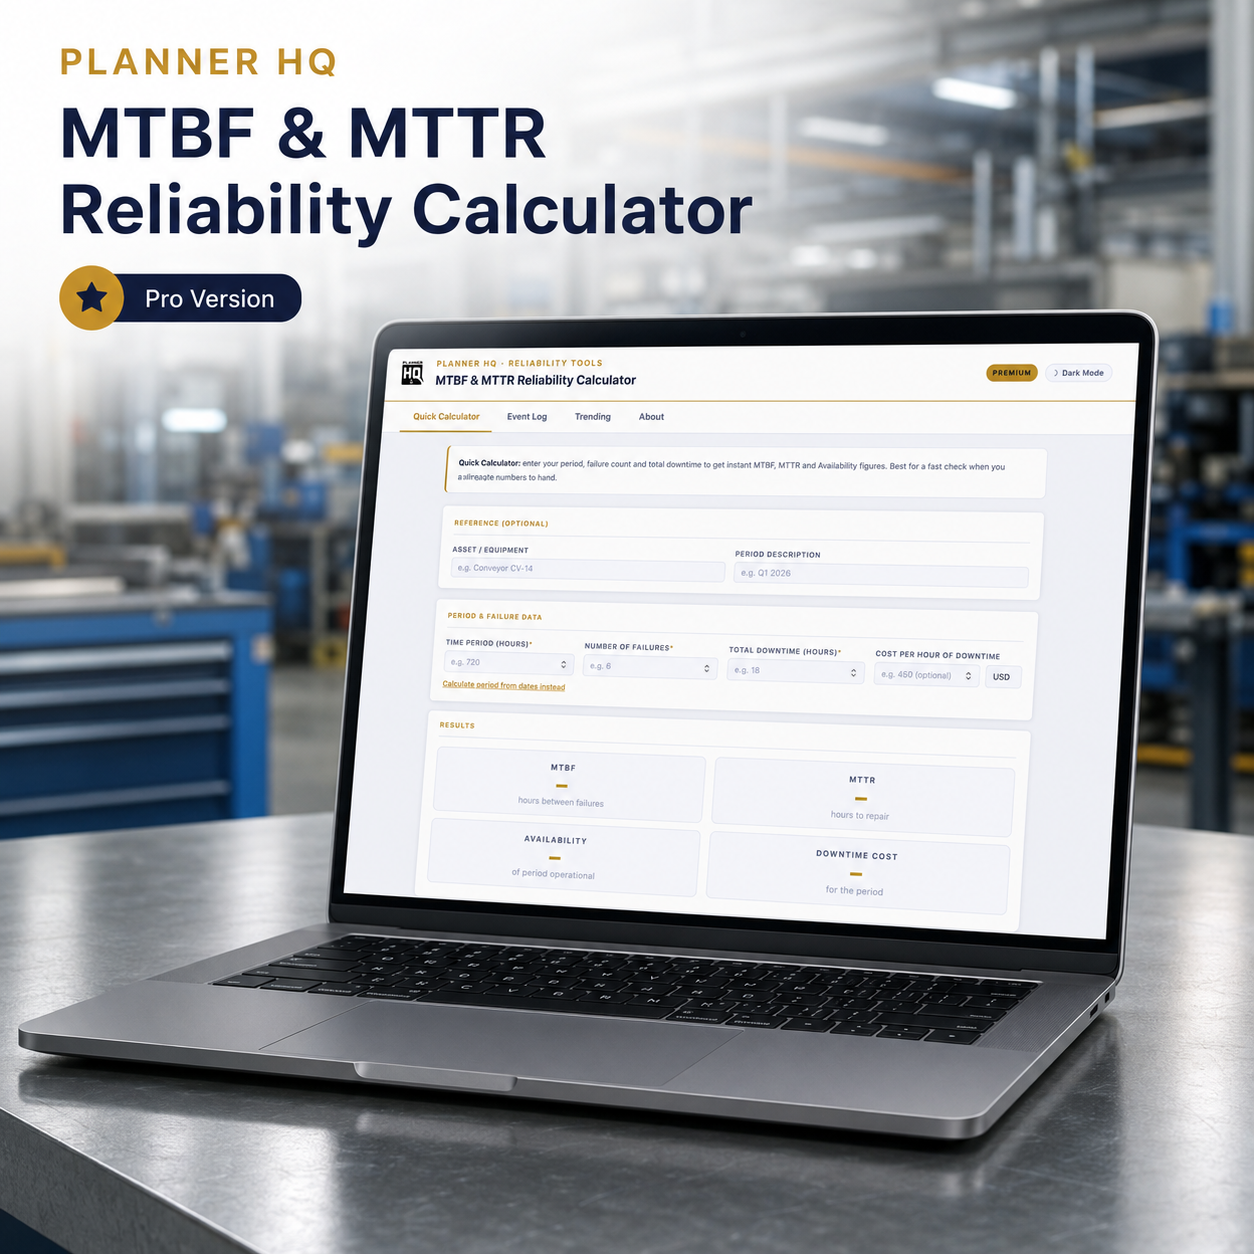
Know your MTBF, MTTR and Availability — without the spreadsheet
A single offline tool that turns raw failure data into the reliability numbers your maintenance strategy actually runs on — built for planners and reliability engineers, not statisticians.
Three numbers, and almost everything else depends on them
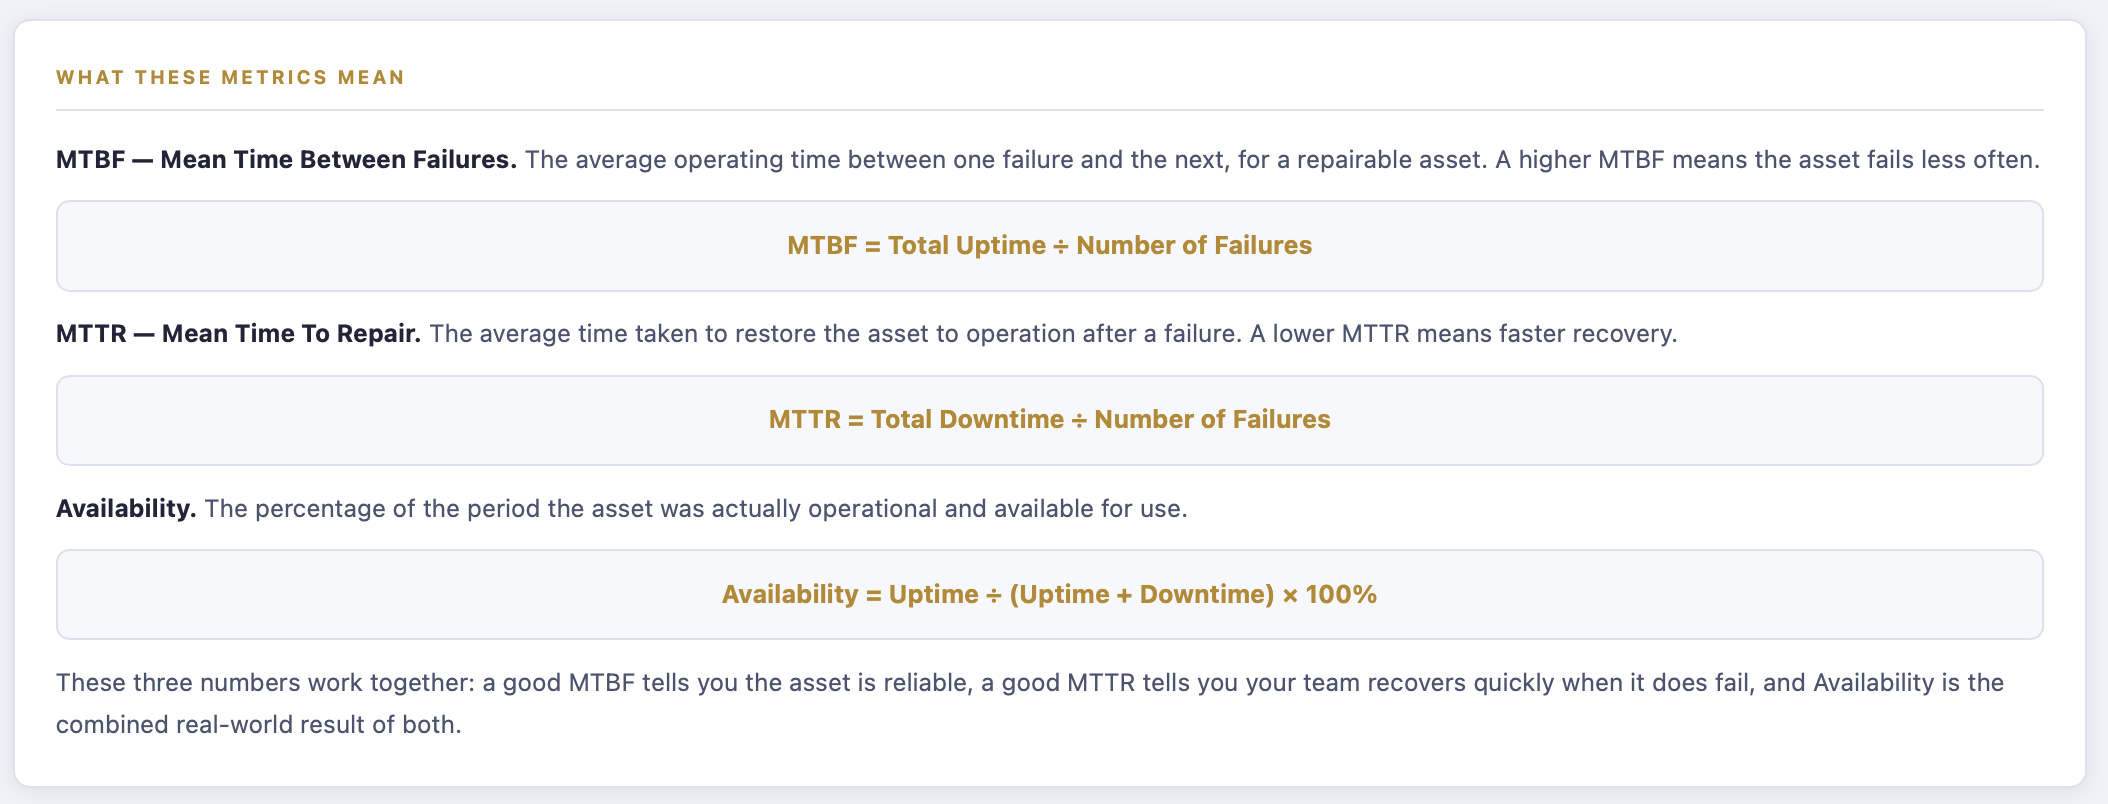
MTBF (Mean Time Between Failures) tells you how reliable an asset actually is — on average, how long does it run before something breaks? A high MTBF means an asset you can plan around confidently. A low one means it’s eating your PM budget and your team’s patience.
MTTR (Mean Time To Repair) tells you how well your team recovers when something does fail — parts availability, technician skill, access, and process all show up in this number. A low MTTR means a resilient operation. A creeping one is usually the first sign of a spares or planning problem before anyone notices it directly.
Availability ties the two together into the number that actually matters to production and leadership: what percentage of the period was this asset actually up and running?
These three figures quietly sit underneath almost every serious maintenance decision — how tight a PM interval should be, whether an asset justifies redundancy or a spares holding, whether a capital replacement case stacks up, and what you report to leadership as evidence the maintenance function is working. Get them wrong, and everything built on top of them is wrong too.
Most sites either build a homegrown spreadsheet (one small formula error away from being wrong, and rarely checked by a second person), use a generic online calculator that only handles a single quick number and nothing else, or don’t calculate it consistently at all — different planners using different definitions, different periods, different assumptions about what counts as downtime. None of that gives you numbers you can defend in a review meeting, let alone track over time.
Four ways to get to the right number
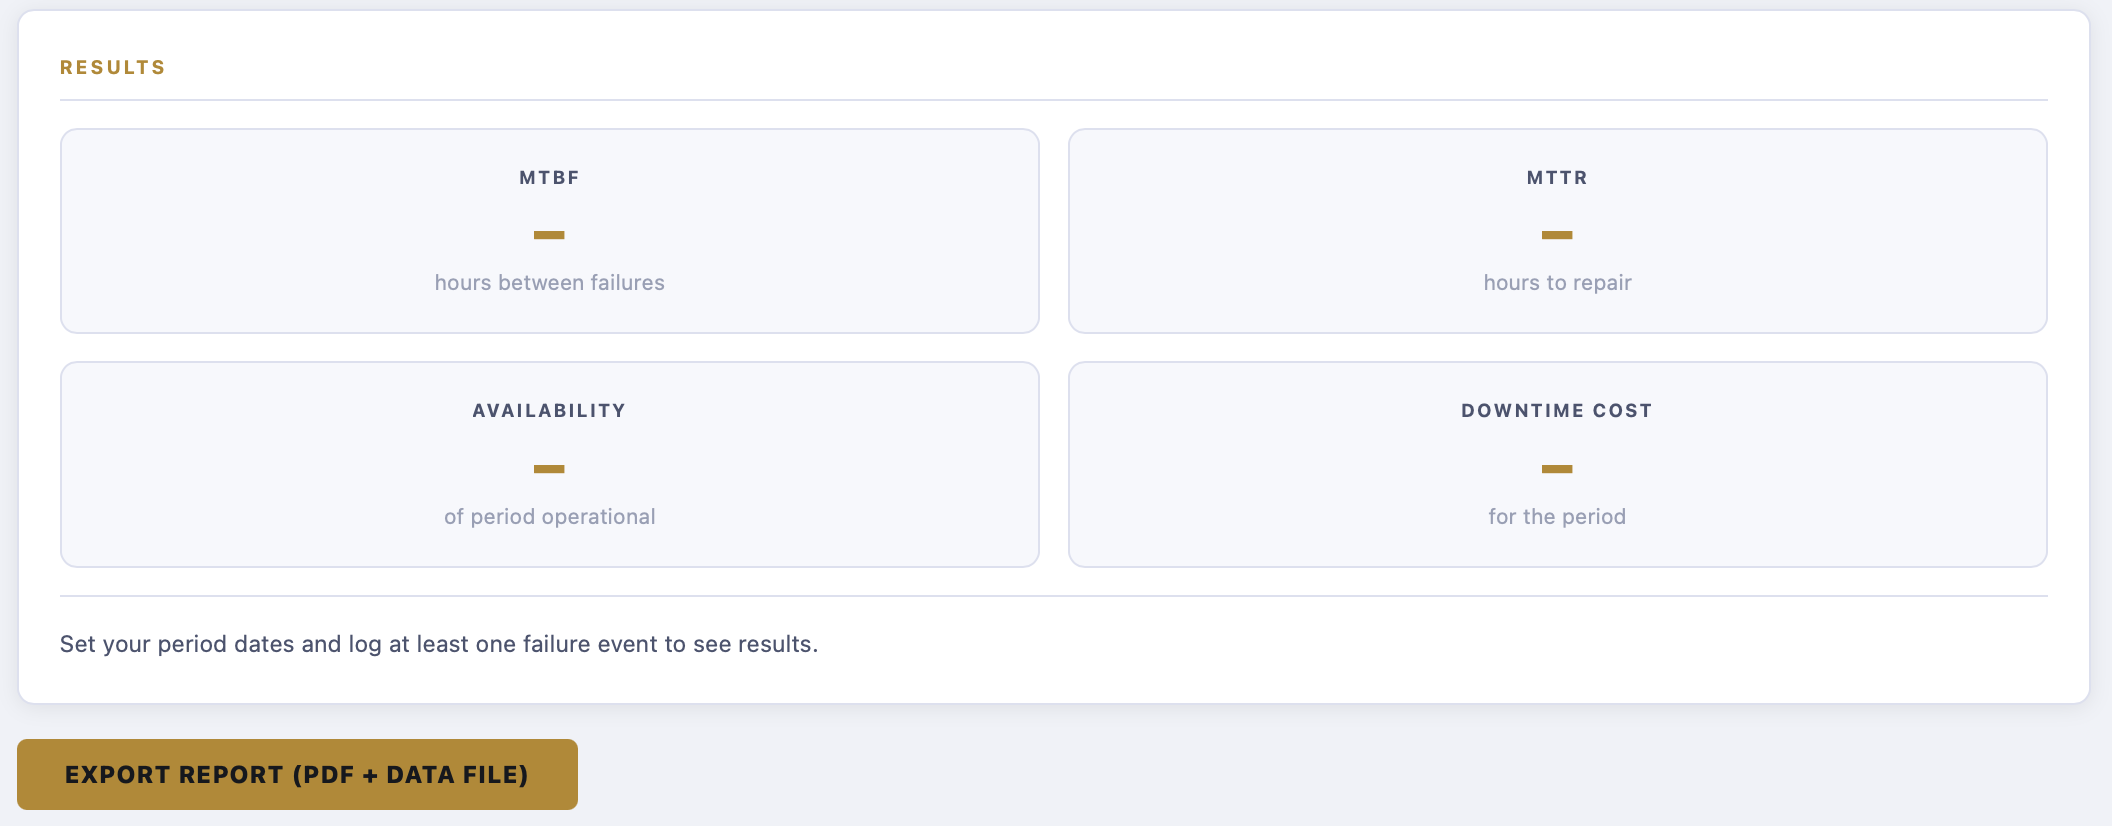
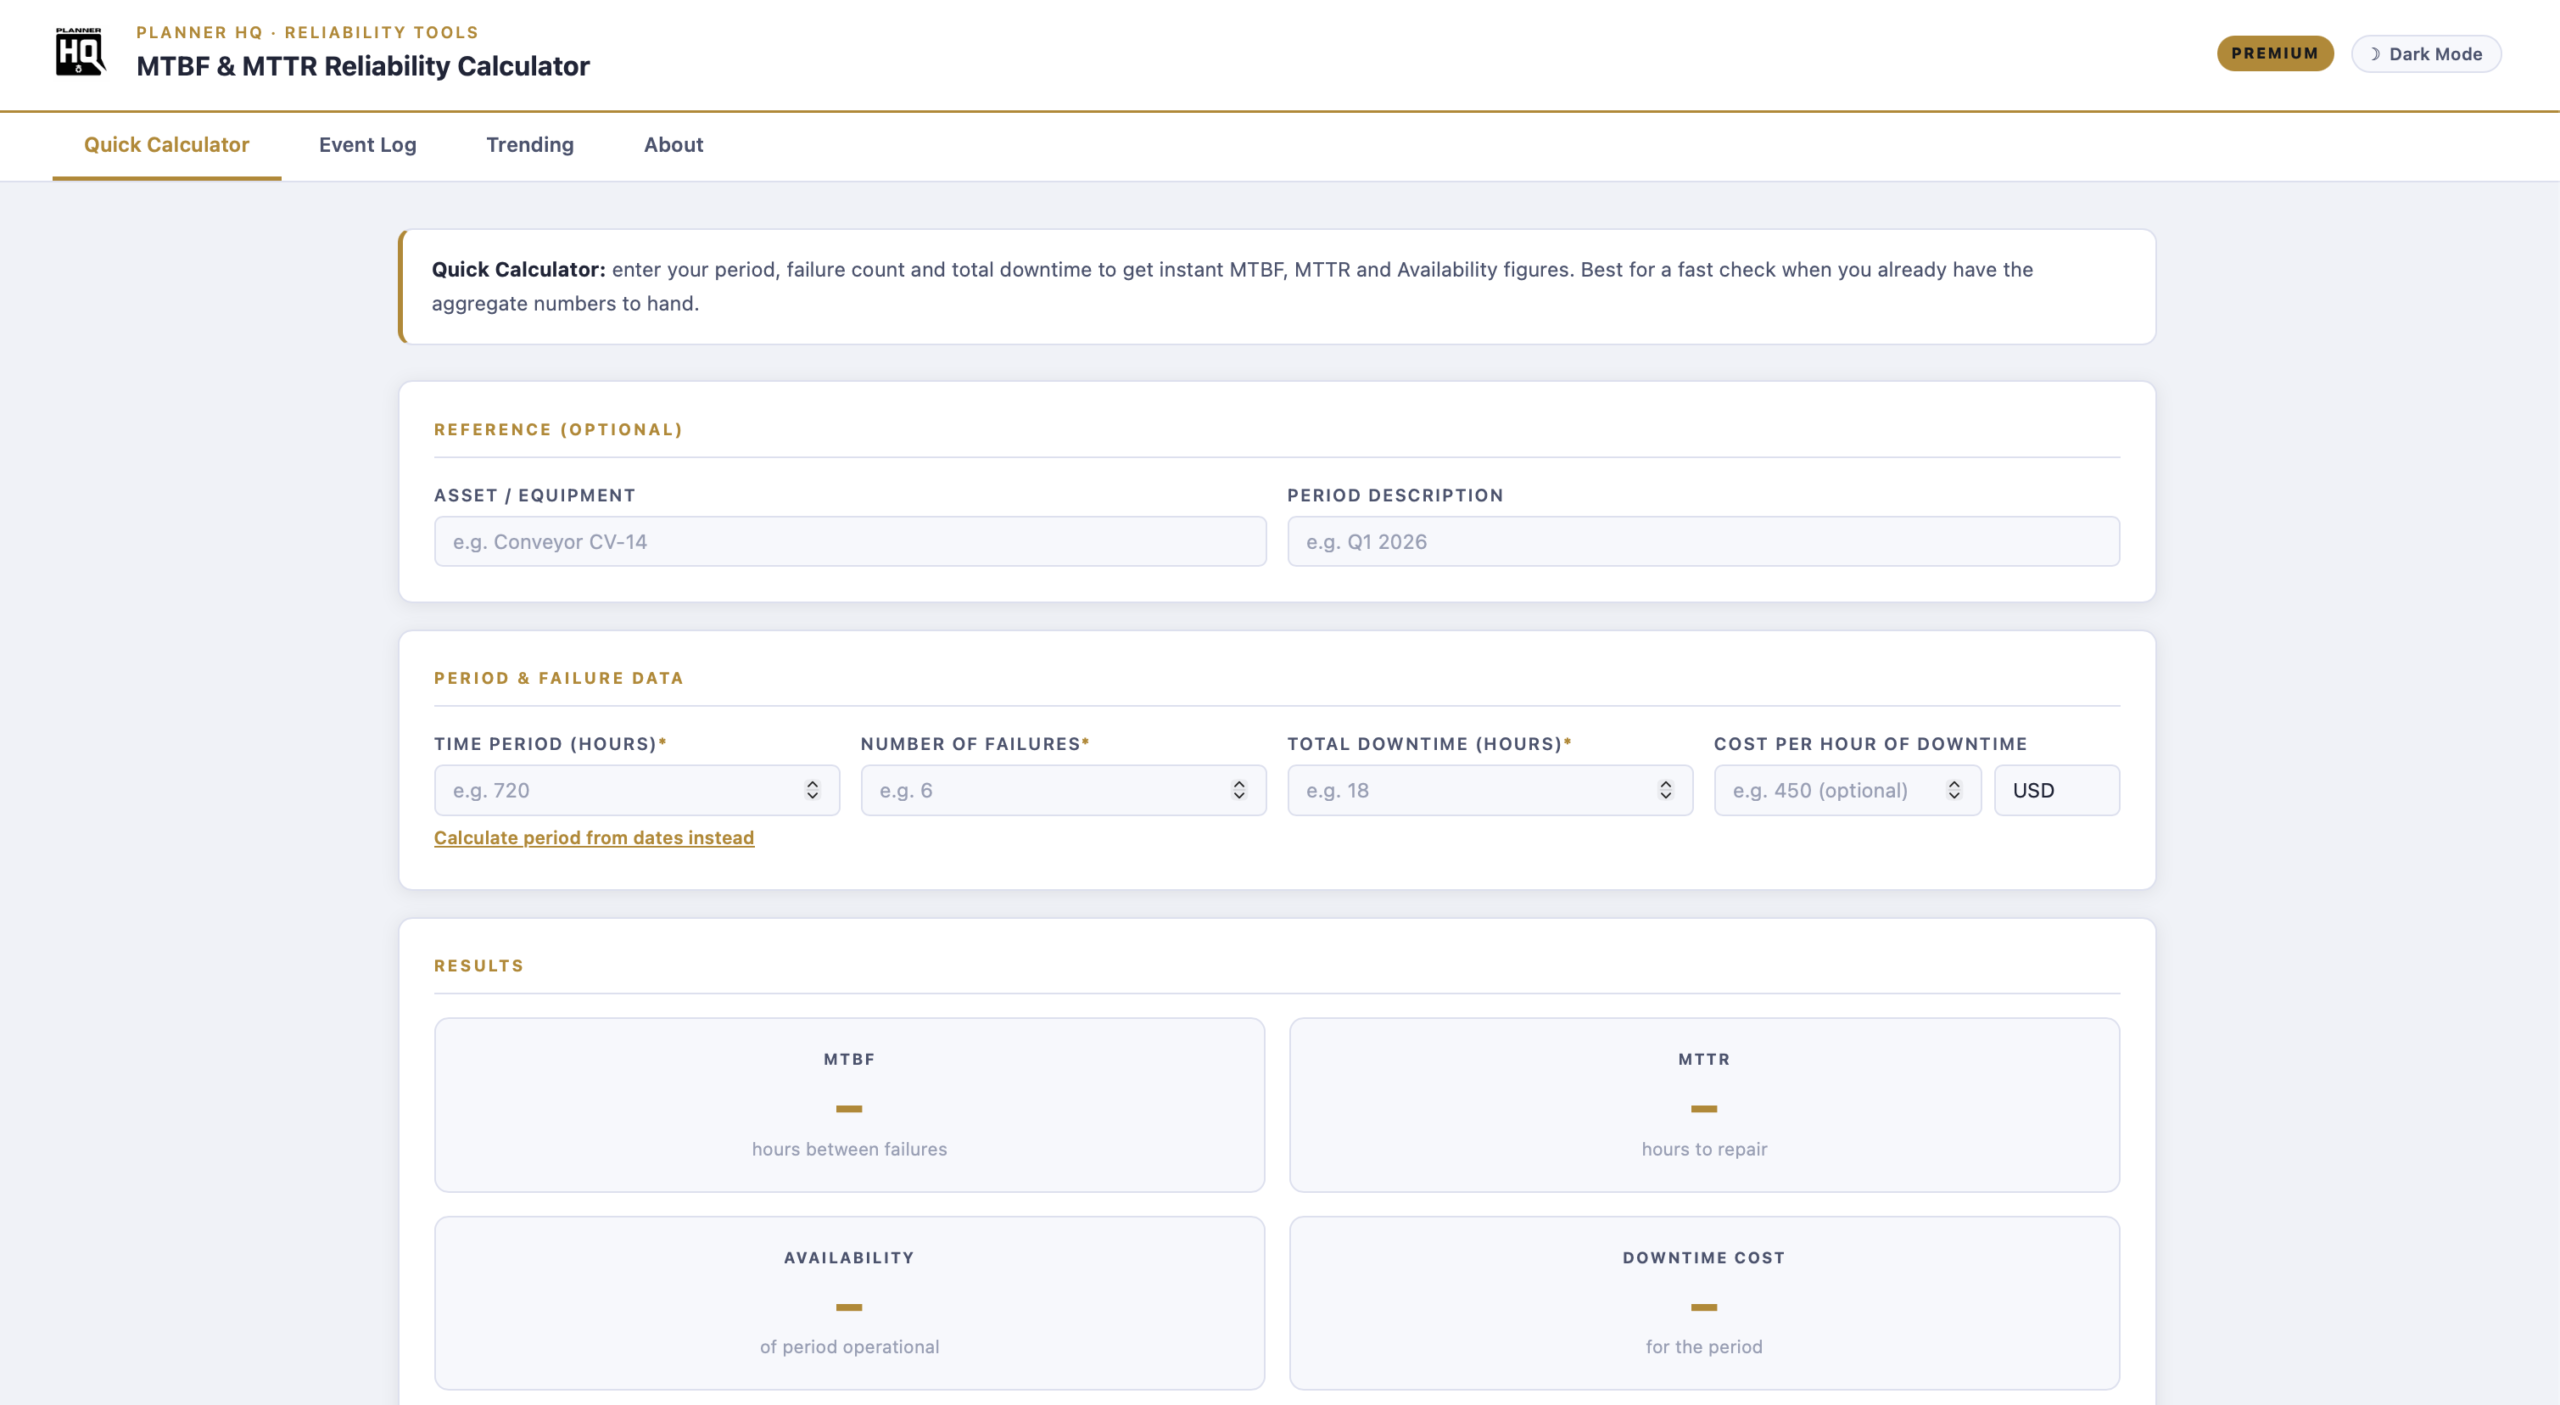
What it does: takes the aggregate numbers you already have — time period, number of failures, total downtime — and instantly returns MTBF, MTTR and Availability.
How it works: strict validation on every field — whole-number failure counts, downtime that can’t exceed the period, no silent rounding or guessing at bad input. If the numbers don’t add up, it tells you why instead of quietly giving you a wrong answer.
What you get: an instant, correct answer for the fast check — a monthly KPI pack, a quick sense-check before a meeting, or confirming a number someone else has quoted you.
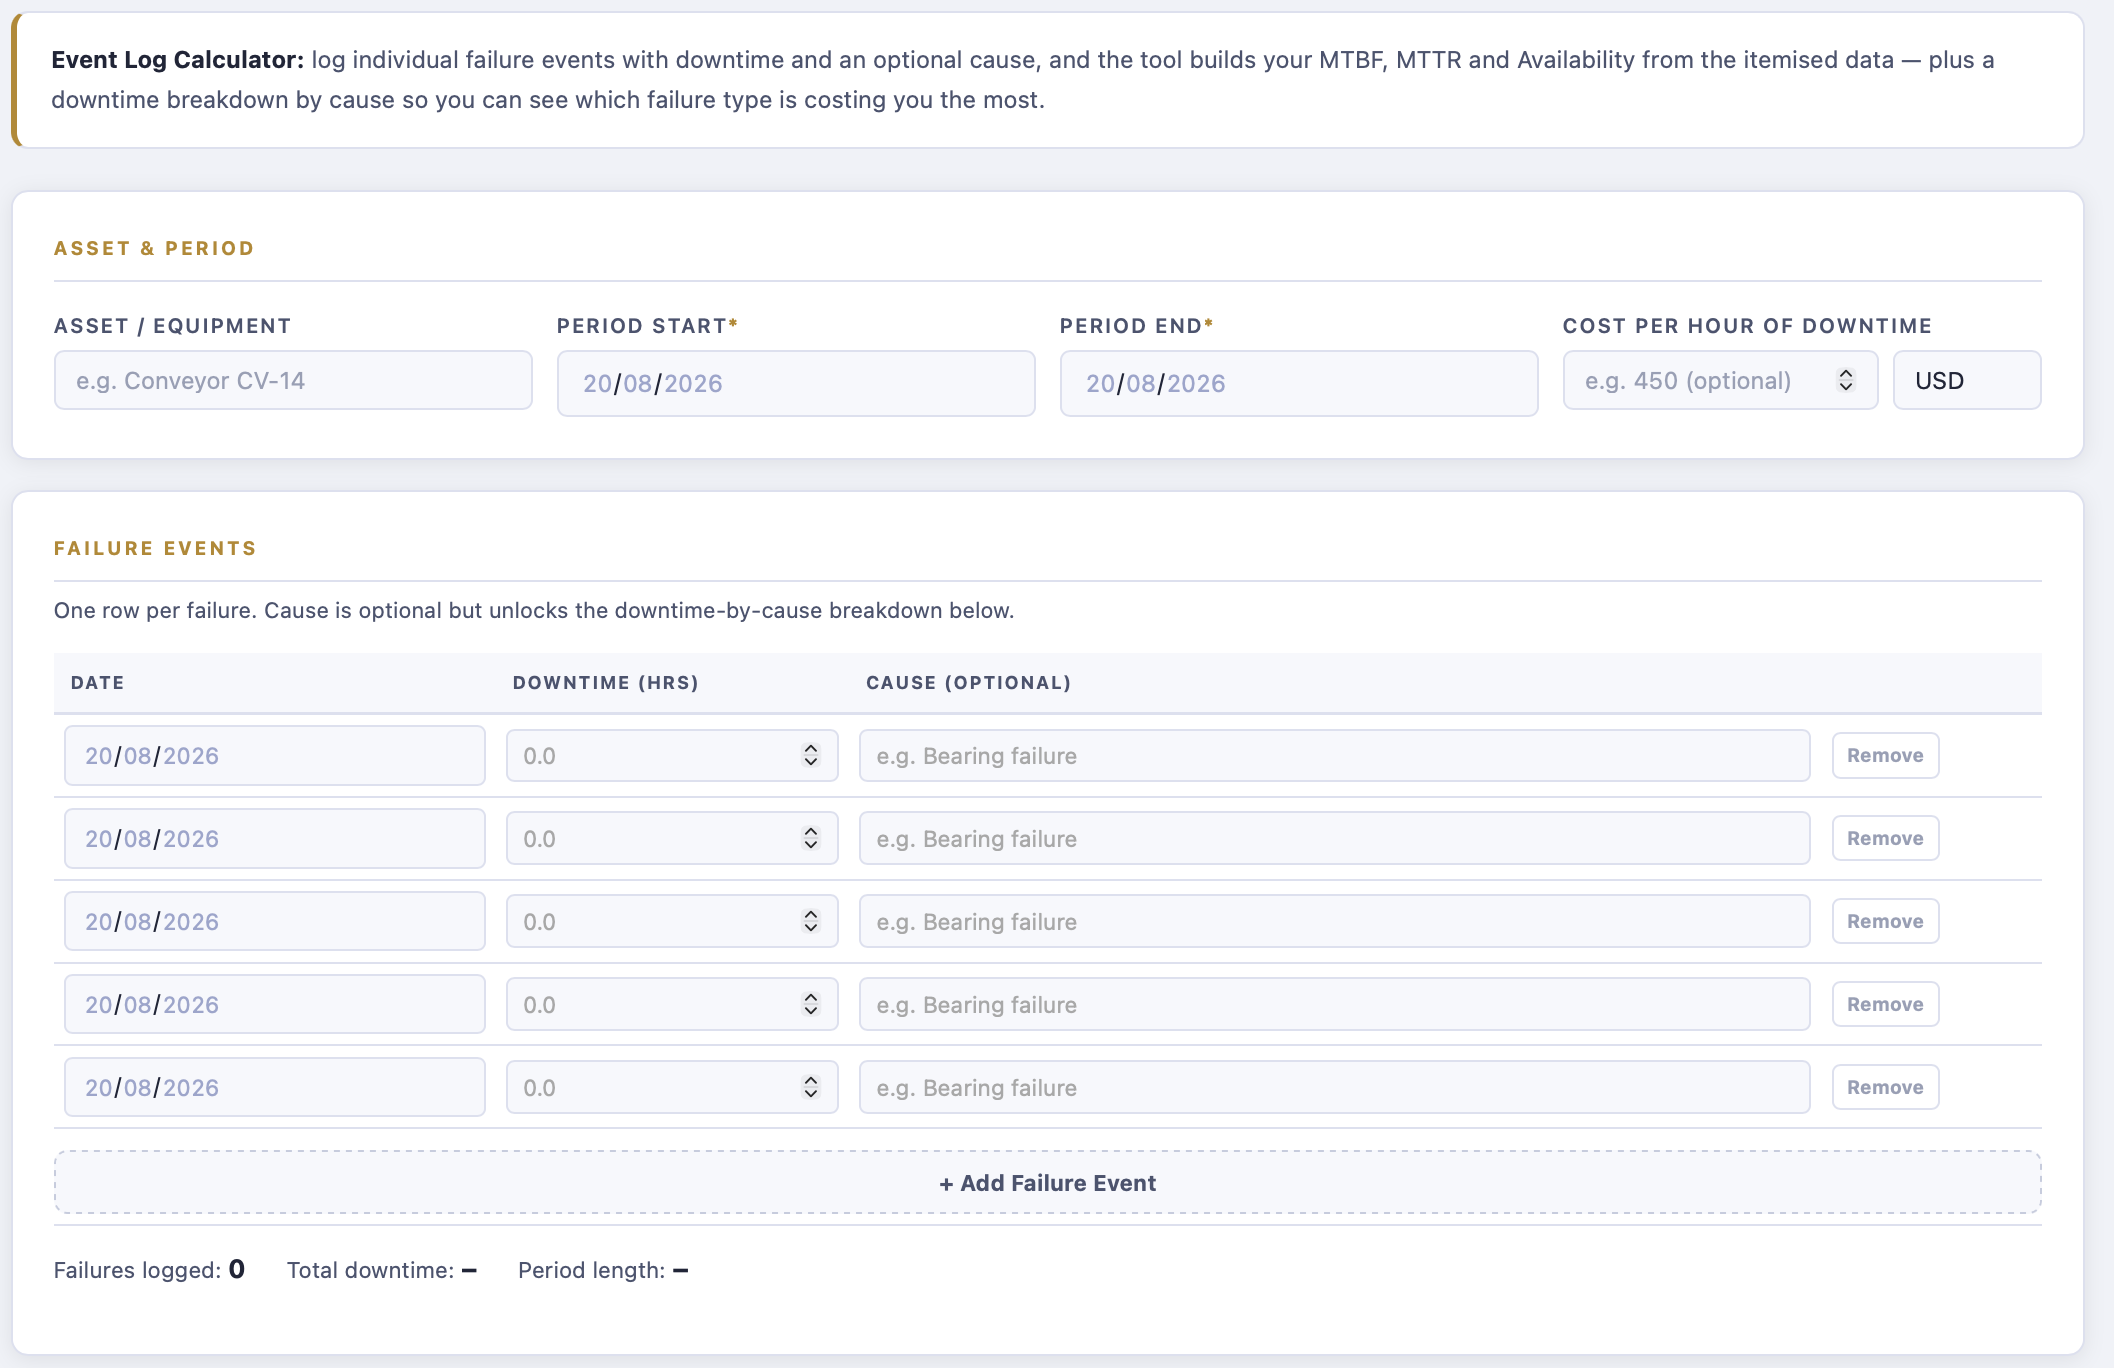
What it does: log every individual failure with its date, downtime and cause, and the tool builds MTBF, MTTR and Availability from the ground up — not from a summary you typed in, but from the actual events.
How it works: every event is validated against your selected period — a date outside the range, a missing downtime figure, or a negative number gets caught and flagged before it can quietly distort your result. This is where most homegrown spreadsheets fail silently; this tool won’t.
What you get: a defensible, audit-ready breakdown, plus a downtime-by-cause view showing exactly what’s actually driving your failures — not just that they happened.
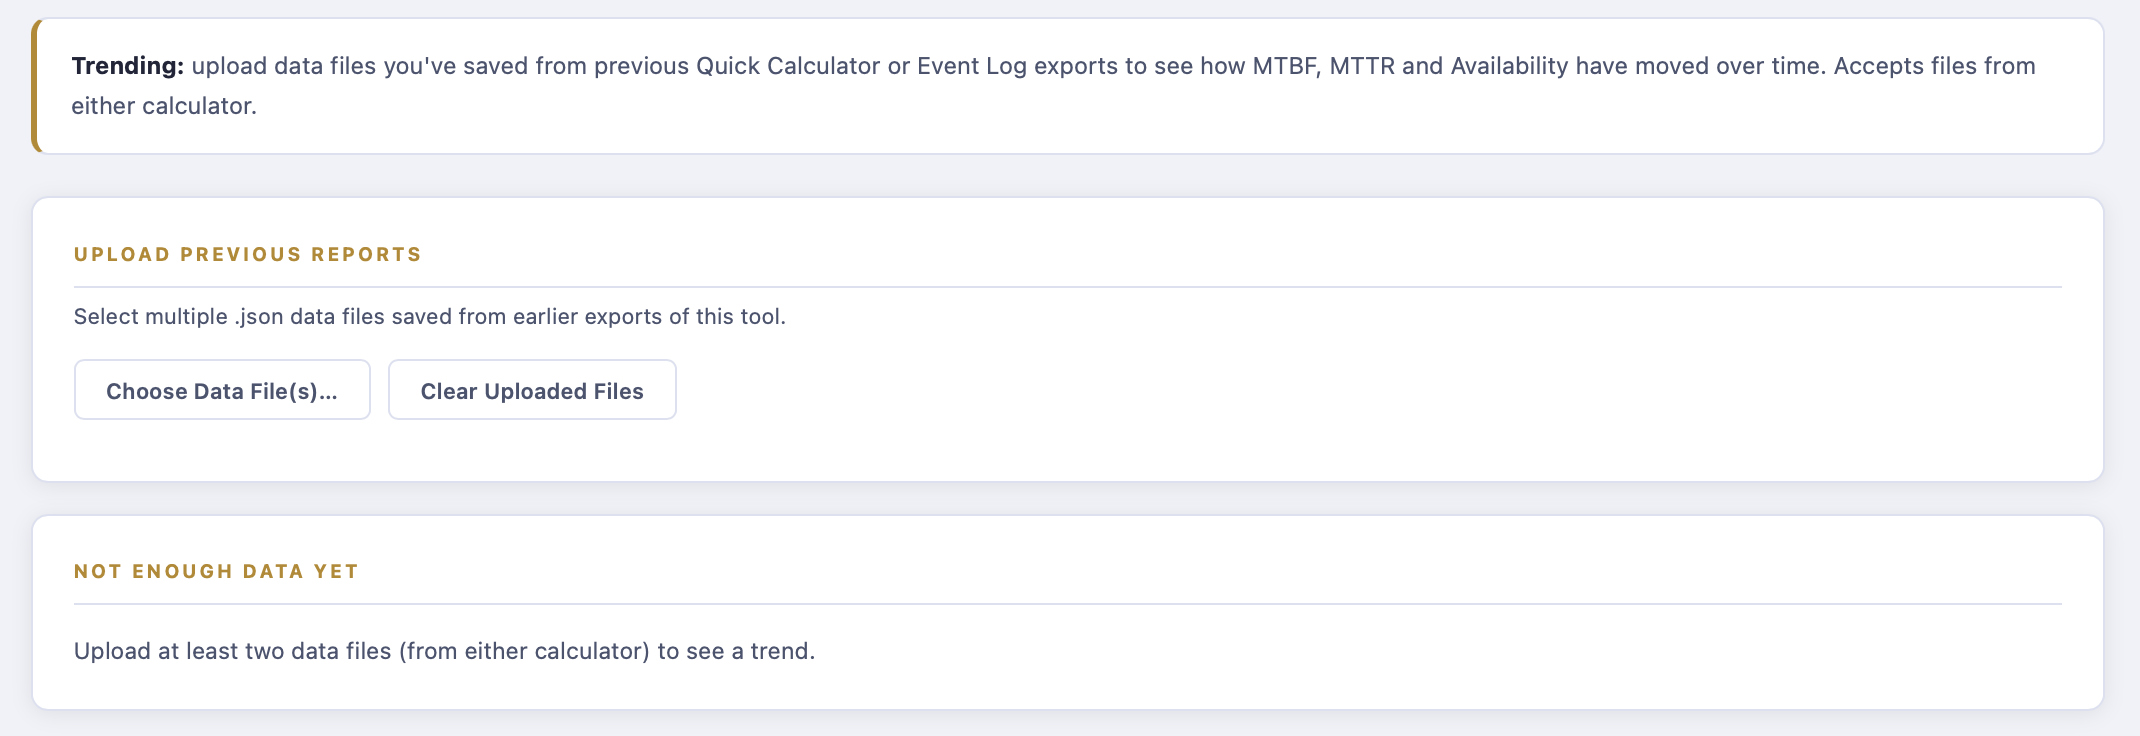
What it does: upload your past exports and watch MTBF, MTTR, Availability and downtime cost tracked report over report — is this asset actually getting more reliable, or has it just felt that way?
How it works: every uploaded file is independently re-validated and cross-checked against its own source data before it’s allowed into the trend — duplicate uploads are automatically detected and ignored, so your chart never quietly doubles up a report.
What you get: the evidence base most sites simply don’t have — a real trend line to put behind a capital replacement case, a coaching conversation, or a claim that a recent change actually worked.
What it does: put a real number on downtime in your own currency (USD, GBP, EUR, AUD, CAD or Other), then model what a faster MTTR would actually be worth — drag one slider and see the projected saving.
How it works: the same validated period, failure and downtime data feeds straight into the cost model, so there’s no separate spreadsheet to keep in sync and no risk of the two disagreeing.
What you get: the number that actually gets a spares investment or a training budget approved — not “reliability would improve,” but a specific projected saving in real money.
| ✓ | Quick Calculator, Event Log and Trending, in one tool |
| ✓ | Downtime cost calculation and What-If MTTR modelling |
| ✓ | Multi-currency support (USD, GBP, EUR, AUD, CAD, or Other) |
| ✓ | PDF report export and CSV data export |
| ✓ | Light and dark mode |
| ✓ | Fully offline — works in any browser, no install, no login |
| ✓ | One-time purchase — no subscription, yours to keep |
Maintenance planners, reliability engineers, and anyone who needs to report or defend equipment reliability figures — whether that’s a monthly KPI pack, a criticality review, a capital replacement case, or simply making sure the numbers in the meeting are actually right.